
Synthesis of Remote Sensing and Field Observations to Model and Understand Disturbance and Climate Effects on the Carbon Balance of Oregon and Northern California
The project tests and demonstrates the bottom-up and top-down paradigm of the North American Carbon Program. To quantify and understand the carbon budgets of Oregon and northern California (Figure 2), a spatially nested hierarchy of field and satellite remote sensing observations is combined with a widely-used prognostic model of terrestrial carbon exchange (Biome-BGC) to implement a "bottom-up" approach that we previously tested in western OR coniferous forests. The "top-down" approach for regional and global applications uses a model-data fusion scheme to estimate monthly NEP and to partition it among gross primary production, autotrophic respiration, and heterotrophic respiration.
The approaches will be compared and evaluated to make improvements and provide critical understanding of major uncertainties about the carbon cycle. It will result in new understanding of important terrestrial carbon cycle processes, notably:
- The effects of disturbance regimes, management, and land use on carbon stocks and fluxes in this region that is influenced by wildfire, logging, and urbanization.
- The effects of interannual climate variation on carbon fluxes and the linkage between carbon and water fluxes across this seasonally drought affected region, and
- The interactions between climate and disturbance across the large environmental gradient.
- The relative magnitude of emissions and carbon sequestration will be investigated along a N-S gradient of anthropogenic carbon emissions. As part of the US-Italy bilateral, the top-down approach and a bottom-up approach is being applied in Italy. We will compare effectiveness of methods and synthesize results with a global perspective. Italy is a region with similar environmental and emissions gradients and seasonal drought, but substantially different land-use history and land-cover change.
GOAL: To develop and apply an approach to quantify and understand the regional carbon balance of the west coast states for the North American Carbon Program.
OBJECTIVE: As an element of NACP research, the proposed investigation is a two pronged approach that derives and evaluates a regional carbon (C) budget for Oregon, Washington, and California. Objectives are (1) Use multiple data sources, including AmeriFlux data, inventories, and multispectral remote sensing data to investigate trends in carbon storage and exchanges of CO2 and water with variation in climate and disturbance history; (2) Develop and apply regional modeling that relies on these multiple data sources to reduce uncertainty in spatial estimates of carbon storage and NEP, and relative contributions of terrestrial ecosystems and anthropogenic emissions to atmospheric CO2 in the region; (3) Model terrestrial carbon processes across the region, using the Biome-BGC terrestrial ecosystem model, and an atmospheric inverse modeling approach to estimate variation in rate and timing of terrestrial uptake and feedbacks to the atmosphere in response to climate and disturbance.
APPROACH: In performing the regional analysis, the research plan for the bottom-up approach uses a nested hierarchy of observations that include AmeriFlux data (i.e., net ecosystem exchange (NEE) from eddy covariance and associated biometric data), intermediate intensity inventories from an extended plot array partially developed from the PI's previous research, Forest Service FIA and CVS inventory data, time since disturbance, disturbance type, and cover type from Landsat developed in this study, and productivity estimates from MODIS algorithms. The BIOME-BGC model is used to integrate information from these sources and quantify C balance across the region. The inverse modeling approach assimilates flux data from AmeriFlux sites, high precision CO2 concentration data from AmeriFlux towers and four new calibrated CO2 sites, reanalysis meteorology and various remote sensing products to generate statewide estimates of biosphere carbon exchange from the atmospheric point of view.
2011
Forest bioenergy increases carbon dioxide emissions to the atmosphere. Forests currently capture a large portion of the carbon emitted worldwide and some of this carbon is stored in pools such as wood and soil that can last hundreds to thousands of years. Forest management practices affect forest carbon uptake and storage; harvest removes carbon from the forest and returns it to the atmosphere over time. Changes in management potentially increase or decrease emissions to the atmosphere. Woody biomass can be used as a bioenergy source both for electricity by combustion or for fuel by conversion to cellulosic ethanol. Thinning forests for wood bioenergy is commonly thought to be carbon-neutral because the forest re-grows and recaptures carbon, and there is the expected added benefit of protecting forests from carbon emissions due to wildfire. In the PNW U.S., unfortunately, more carbon is lost due to thinning for fire prevention in all areas but those projected to have a high risk of burning because most of what burns is surface fuels and more carbon is removed than would combust if it were to burn. Wood bioenergy also produces emissions, and life cycle assessment showed that the emissions proved to be more than the carbon savings. This study showed that in the US west coast states, projected forest biomass removal and use for bioenergy (any form) releases more carbon dioxide to the atmosphere than current forest management practices. The reasons are: (1) Current forest practices (and conditions) in the PNW U.S. result in a strong regional sink for carbon and the only way to make is stronger in some areas is to reduce harvest; (2) Fire emissions are low compared to removals needed to prevent those emissions; (3) Carbon-based energy is used to produce bioenergy. The amount of fossil fuel carbon used is high and the returns are low; (4) Not all the wood that is removed is actually used for bioenergy. Manufacturing of the associated wood products also emits fossil fuel carbon, and the wood products emit carbon as they decompose over time (e.g. in landfills). Caveats are that forests in high fire risk zones or are weakened carbon sinks due to insect outbreaks or drought may benefit from treatment and thus result in lower emissions than those resulting from currently management, but only 3 out of 19 ecoregions in the three west coast states had these conditions. In those areas where thinning for bioenergy pro-duction and forest protection result in lower emissions than current practices, the emissions savings depend on the level of thinning, the mix of energy utilized (ethanol vs direct combustion), the ratio of wood products versus bioenergy, distance transported, and the efficiency with which either are produced (Hudiburg et al. Nature Climate Change, 2011; product of PhD GREF and this project).
The Northwest Forest Plan (NWFP) enacted in 1993 was designed to conserve old growth forests and protect species such as the northern spotted owl, but we conclude that it had another powerful and unintended consequence – increased carbon sequestration on public lands. When forest harvest levels fell ~80% on public forest lands in the years after passage of the NWFP, they became a significant carbon sink for the first time in decades. Yet, private forest lands were close to carbon neutral. We combined satellite data, and input data from AmeriFlux sites to model forest carbon stocks and fluxes over Oregon, N California and Washington with the process model Biome-BGC, and evaluated the modeled NEP with AmeriFlux data. The remote sensing inputs include stand replacing disturbance, forest age, and 9 vegetation classes, and we used our field measurements of combustion factors for different forest pools to prescribe emissions where the remote sensing data showed there were fires. We also included state data on wood harvest. Previous estimates of forest carbon balance had suggested a significant loss of carbon from Pacific Northwest forest lands between 1953 and 1987, associated with a high rate of old growth timber harvest. Those harvests peaked in the mid-to-late 1980s. Forest fire is also an issue in carbon emissions, but we found that the magnitude of emissions linked to fire was modest, compared to the impacts of harvesting forests. Even the massive Biscuit Fire in southern Oregon in 2002 released less carbon into the atmosphere than what was removed by logging that year. The findings are of some interest because the value of carbon sequestration is now something that can be quantified in economic terms, and then incorporated into management decisions and policies (Turner et al. 2011).
Eddy-covariance flux databases provide a powerful tool to evaluate and optimize biosphere process models that simulate the coupled carbon cycle-climate feedbacks. Using the FLUXNET La Thuille database and the AmeriFlux database, we assembled observations from 29 sites located in 11 states or provinces, resp., with a total of >73 continuous data years representing the dominant biomes in the region. The purpose was to find the optimum model structure (e.g. the number of free parameters, biosphere processes resolved) and the most suitable input datasets for a simple biosphere flux model to be coupled to a regional scale inverse modeling framework. Comparing simulations to the reference fluxes confirmed that a relatively simple model setup (8 free parameters) provided the best information gain, and emphasized the important influence of accurately capturing the effects of soil moisture and soil temperature on carbon fluxes. The ratio of actual to potential evapotranspiration was found to be the most suitable indicator of water stress on vegetation in simple light-use efficiency models, which don’t include pools for water or carbon. The improved model version therefore integrates MODIS evapotranspiration data layers into the modeling framework. (Göckede et al, in prep.)
Atmospheric inverse modeling frameworks have to assimilate different input data layers across multiple spatiotemporal scales to constrain terrestrial carbon budgets. Finding the right balance between the role of these different data layers is a critical task, since amount and quality of the data influences uncertainty settings, and this way also the degrees of freedom the inverse algorithm has to generate flux fields. In a proof-of-concept study, we tested the usefulness of geostatistical inverse modeling (GIM) tools to evaluate biosphere flux model performance and the role of different input data layers. GIM is capable of constraining terrestrial carbon budgets based on how flux fields are correlated across time and space, and how multiple ancillary environmental data layers are related to the spatiotemporal variability in carbon fluxes. It is therefore possible to run GIM without prescribing rigid prior patterns in flux model algorithms and/or parameter settings. Our study results indicate that GIM output can highlight structural deficiencies in the model itself, and can help to identify the most suitable input data layers for a given model domain (Göckede et al, in prep).
2010
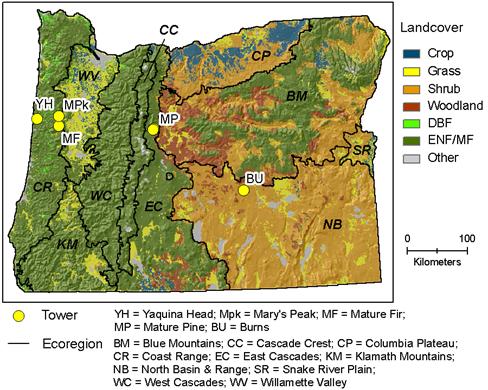
Atmospheric inverse modeling proof of concept (top-down modeling; Göckede et al. 2010a). We developed an inverse modeling framework designed to constrain CO2 budgets at regional scales. The approach captures atmospheric transport processes in high spatiotemporal resolution by coupling a mesoscale model with Lagrangian Stochastic backward trajectory simulations. It is essentially a data assimilation approach, designed to combine information from multiple data sources (see above) to reduce uncertainty in estimates of terrestrial biosphere fluxes. Terrestrial biosphere CO2 emissions are generated through a simple diagnostic flux model that computes the major components of net carbon exchange (GPP, Ra, Rh). The modeling framework assimilates datasets for advected background CO2 and anthropogenic fossil fuel emissions as well as highly resolved remote sensing products (MODIS fPAR, Landsat disturbance, age and land cover). We used a Bayesian inversion setup optimizing a posteriori flux base rates for surface types that are defined by the remote sensing products. This strategy significantly reduces the number of parameters to be optimized compared to solving fluxes for each individual grid cell, thus permitting description of the surface in very high resolution. The modeling framework was trained and tested using time series of our high precision CO2 observations measured at two AmeriFlux tower sites in Oregon. We found the optimum timestep was 4 hours and spatial scale 6km or less. It was effective to classify biomes by ecoregion to characterize their different biogeochemical responses to environmental variables across climatic gradients. Stand age information also improved model performance.
Sensitivity of a Sub-Regional Scale Atmospheric Inverse CO2 Modeling Framework to Boundary Conditions (Göckede 2010b). This study focuses on the impact of uncertainties in advected background CO2 (CarbonTracker, provided by NOAA CMDL) and fossil fuel emissions (VULCAN data, , provided by K. Gurney, Purdue Univ.) on simulated regional scale carbon budgets. We also tested the impact of allowing optimized parameter sets to vary seasonally. We found the simulations to be highly sensitive to systematic changes in advected background CO2, while shifts in fossil fuel emissions played a minor role. Correcting for local-scale biases in the CarbonTracker background concentrations reduced the annual terrestrial CO2 sink by about 25 percent, and improved the correspondence with the output produced by bottom-up modeling frameworks. Using an optimization strategy with seasonally varying parameters improved the model output, as compared to parameter sets that are constant throughout the year. Analysis of 2 full years of CO2 observations yielded significant interannual variability between 2007 and 2008, and resulted in an averaged statewide CO2 sink of about 45 Tg C per year. In our previous paper, the sink in 2003 and 2004 was 27 and 35 Tg C per year, indicating an almost two-fold range in NEP from year to year.
Disturbance mapping - Change Detection (Remote sensing results). We completed approximately 5-year interval disturbance mapping for western WA, all of OR, and northern CA from 1972-2004, which will be used in the bottom-up modeling for changes in carbon balances over time. All of OR has been modeled, but we will now model only portions of WA and CA, which is a deviation from the original modeling plan. With the recent availability of free Landsat data, we are augmenting our analyses using annual time series (LandTrendr; Kennedy et al. 2007). The annual mapping is based on dense timeseries analysis of Landsat imagery. The approach characterizes both stand replacing disturbances (harvest, high severity fires)and partial disturbances (thinning, low intensity fires), including those that occur over a protracted period of time (woody encroachment, mortality caused by insects or drought) and are difficult to detect using only 5-year time steps (Kennedy et al. 2007). These maps will greatly improve our understanding of forest disturbance events across large spatial domains. Distinguishing between fire and harvest in an automated way remains a challenge. We continue to work on this problem, and have a first approximation. In the interim, we rely on the Monitoring Trends in Burn Severity (MTBS) product, as it focuses exclusively on fire, and captures several levels of burn. Using 60 field plots, we evaluated the MTBS product, and it appears to capture severity levels consistent with our observations (Meigs et al. in review). We have also developed an assessment tool to characterize annual forest change mapping errors (Cohen et al. accepted). Error assessment will continue through the end of the project.
Thus far, we have completed the annual disturbance mapping from 1984-2007 for CA and western WA and OR. We are in the process of mapping annual disturbance for eastern WA and expect to complete them by August 2010. Unfortunately, the annual maps will not be available in time for us to use them in the bottom-up modeling for assessing state level changes in carbon budgets before the project ends, so we were not able to meet this objective.
FIA plot and Landsat spectral data were used previously to model stand age as a continuous variable for all forested ecoregions in Oregon and California. Relationships are weak but models that capture the distribution of stand age on the landscape were developed and applied. (Duane et al, 2010). Using these same methods, continuous age maps have been produced for western WA. Age maps for eastern WA will be completed by August 2010. Unfortunately, we are not able to use these maps in our modeling before the project ends.
2009
Forest thinning effects on carbon fluxes (Intensive field plot results). The thinning of forests to reduce fire hazard is a wide spread type of forest disturbance not explicitly accounted for in our modeling, yet we recognize the need to do so. Aboveground Net Primary Production is reduced by thinning, as prescribed in the Forest Hill, CA study area of our intensive plots, and often returns to near pre-thinned levels by 16 years, more time than was previously assumed (5 yr). Thinning in this study appears to shift some production from above ground to belowground and from trees to understory. Thinning reduced soil CO2 efflux only modestly and temporarily (Campbell et al. 2009), contrary to expectations due to reduced live fine root mass for autotrophic respiration.
Assessing FPAR source and parameter optimization scheme in application of a diagnostic carbon flux model (groundwork for the biosphere model used in our top-down scheme). The combination of satellite remote sensing and carbon cycle models provides an opportunity for regional to global scale monitoring of terrestrial gross primary production, ecosystem respiration, and net ecosystem production. FPAR (the fraction of photosynthetically active radiation absorbed by the plant canopy) is a critical input to diagnostic models, however little is known about the relative effectiveness of FPAR products from different satellite sensors nor about the sensitivity of flux estimates to different parameterization approaches. In this study, we used multiyear observations of carbon flux at four eddy covariance flux tower sites within the conifer biome to evaluate these factors. FPAR products from the MODIS and SeaWiFS sensors, and the effects of single site vs. cross-site parameter optimization were tested with the CFLUX model. The SeaWiFs FPAR product showed greater dynamic range across sites and resulted in slightly reduced flux estimation errors relative to the MODIS product when using cross-site optimization. With site-specific parameter optimization, the flux model was effective in capturing seasonal and interannual variation in the carbon fluxes at these sites. The cross-site prediction errors were lower when using parameters from a cross-site optimization compared to parameter sets from optimization at single sites. These results support the practice of multisite optimization within a biome or ecoregion for parameterization of diagnostic carbon flux models.
2008
Regional Carbon Stocks (Inventory data results). The potential to store additional carbon in west coast forests is among the highest in the world because much of the area has forests that are long-lived (e.g. Douglas-fir) and maintain relatively high productivity and biomass for decades to centuries. In Oregon and Northern California (4.4 x 10⁷ ha), total live biomass of forests is estimated at 2.71 +/- 0.28 Pg C (mean of 12 kg C ha-1) in the period 1991-1999. Total dead biomass (does not include fine woody debris or litter stocks) of forests in the region was 0.51 +/- 0.19 Pg C, and total NPP was 0.109 +/- 0.001 Pg C y-1. The majority of live and dead biomass (about 65%) is on public lands (53% of forested land). If forests were managed for maximum carbon sequestration total carbon stocks could theoretically double in the Coast Range, West Cascades, Sierra Nevada, and East Cascades and triple in the Klamath Mountains. Our results indicate that Oregon and California forests are at 54% of theoretical maximum levels (3.2 +/- 0.34 Pg C versus 5.9 +/- 1.34 Pg C) given the absence of stand-replacing disturbance (i.e. catastrophic fire) (Hudiburg et al. 2007).
Age-related findings and modeling implications (Inventory data results). Trends in NPP with age vary among ecoregions, which suggests caution in generalizing that NPP declines in late succession. Contrary to commonly accepted patterns of biomass stabilization or decline, biomass was still increasing in stands over 300 years in the Coast Range, the Sierra Nevada and the West Cascades, and in stands over 600 years in the Klamath Mountains (Hudiburg et al. 2009).
2007
Pyrogenic carbon emissions (Intensive field plot results). To properly model Net Biome Production across Oregon and Northern California it is necessary to quantify the pyro-genic carbon releases that result from wildfire. Biome-BGC requires prescription of emissions and carbon transformations into dead pools (e.g. litter, coarse woody debris), yet observations were not previously available for our region. Disturbance mapping can quantify area affected by wildfire, but combustion factors relating fire severity to the fraction of biomass combusted are also required. Quantification of combustion factors across many forest C pools showed that combustion factors were highest for litter, humus, and foliage, lowest for live woody pools (Campbell et al. 2007, Turner et al. 2007). Combustion factors increased with burn severity, but were not nearly as high for tree stemwood as previously assumed. We estimate the total pyrogenic carbon emissions from the Biscuit Fire to be between 3.0 and 3.9 Tg C (16 and 19 Mg C ha-1), close to our initial estimate of 3.0 Tg C (Law et al. 2004). We estimate that this flux is approximately 16 times the annual net ecosystem production of this landscape prior to the wildfire. We estimate that wildfires of 2002 may have reduced mean net biome production across the state of Oregon by nearly half (Campbell et al. 2007, Law et al. 2004).
Land Cover (Remote sensing results). We compiled a land cover map for the entire regional study area based primarily on NLCD2001 and amended with information from previous disturbance maps and Gap Analysis Project (GAP) vegetation maps.
Scaling net ecosystem production and net biome production over a heterogeneous region in the western United States (bottom-up modeling results). Bottom-up scaling of net ecosystem production (NEP) and net biome production (NBP) was used to generate a carbon budget for a large heterogeneous region (the state of Oregon, 2.5 * 105 km2) in the western United States. Landsat resolution (30m) remote sensing provided the basis for mapping land cover and disturbance history, thus allowing us to account for all major fire and logging events over the last 30 years. For NEP, a 23-year record (1980-2002) of distributed meteorology (1 km resolution) at the daily time step was used to drive a process-based carbon cycle model (Biome-BGC). For NBP, fire emissions were computed from remote sensing based estimates of area burned and our mapped biomass estimates. Our estimates for logging and crop harvest removals were from the model simulations and were checked against public records of forest and crop harvesting. All of the predominately forested ecoregions within our study region were NEP sinks, with ecoregion averages up to 197 gC m-2 yr-1. Agricultural ecoregions were also NEP sinks, reflecting the imbalance of NPP and decomposition of crop residues. For the period 1996-2000, mean NEP for the study area was 17.1 TgC yr-1, with strong interannual variation (SD of 10.6). The sum of forest harvest removals, crop removals, and direct fire emissions amounted to 63% of NEP, leaving a mean NBP of 6.1 TgC yr-1. Carbon sequestration was predominantly on public forestland, where the harvest rate has fallen dramatically in the recent years. Comparison of simulation results with estimates of carbon stocks, and changes in carbon stocks, based on forest inventory data showed generally good agreement. The carbon sequestered as NBP, plus accumulation of forest products in slow turnover pools, offset 51% of the annual emissions of fossil fuel CO2 for the state. State-level NBP dropped below zero in 2002 because of the combination of a dry climate year and a large (200,000 ha) fire. These results highlight the strong influence of land management and interannual variation in climate on the terrestrial carbon flux in the temperate zone.
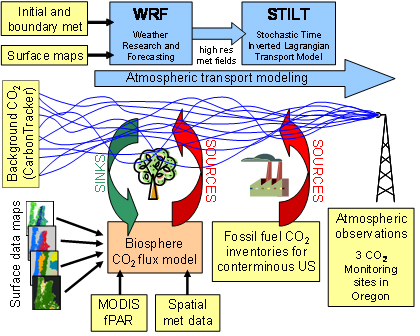
The above figure shows the main components of the ORCA2 inverse modeling framework (blue and orange boxes), and how they are linked with different data sources (yellow boxes).
The dependence of the coefficient of determination (R2) between observed and simulated CO2 mixing ratios is shown for different averaging intervals of the input data (dashed line: Mature Fir; grey dashed line: Metolius. Solid line: composite.
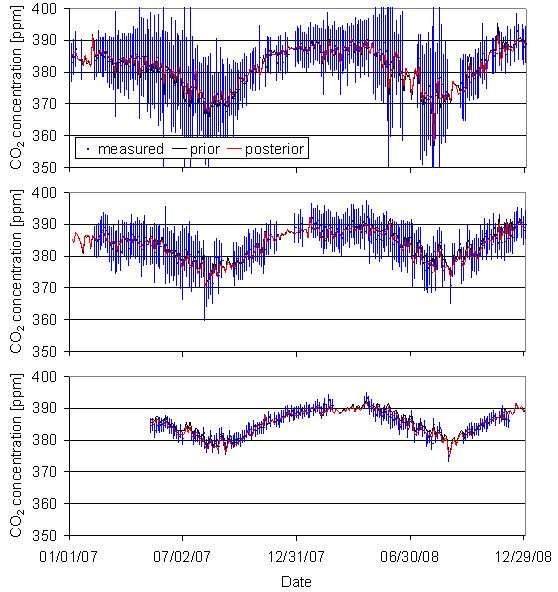
Observed CO2 mixing ratios (blue, with model data mismatch error bars) against simulated results (black lines: prior results; red lines: posterior results) for three observation sites in Oregon (top: Mary’s River; center: Metolius; bottom: Burns)